

A digital marketing KPI (key performance indicator) is a specific, measurable metric that shows how well your online marketing supports concrete business or mission goals—whether that’s revenue, leads, or volunteer signups.
Understanding the difference between “metrics” and “KPIs” is critical. Metrics include all data points like page views and social followers. KPIs are the carefully chosen subset that truly drive decisions. While your website may generate hundreds of data points, leadership should focus on 8–12 key KPIs.
Examples of Goal–KPI Bundles:
| Goal | Primary KPIs |
|---|---|
| Increase online store revenue from $40,000/month to $60,000/month by December 31, 2026 | E-commerce conversion rate, average purchase value, ROAS by channel |
| Generate 150 qualified RFQ submissions per quarter | Cost per lead, MQL-to-SQL conversion rate, lead source mix |
| Grow year-end giving by 20% | Email conversion rate, donation page conversion rate, donor retention rate |
Marketing and sales teams review KPIs on a set schedule—weekly for active campaigns, monthly for strategy, quarterly for leadership.
Why Tracking Digital Marketing KPIs Matters
With global digital ad spend projected to exceed $1.2 trillion by 2026, organizations must ensure every dollar counts. Without tracking KPIs, budget allocation relies on guesswork.
KPIs reveal which channels—organic search, paid search, social media, email—drive results. This shifts discussions from subjective opinions to data-driven decisions. At Cross & Crown, KPI reporting is integral to ongoing marketing optimization.
How to Choose the Right KPIs
Not all KPIs fit every organization. The right KPIs align with your specific goals.
Backwards Planning:
- Define your main goal (e.g., “add $500,000 in online revenue in 2026”).
- Break it into traffic, conversion, and retention KPIs.
- Assign ownership and review cadence.
Use the SMART framework: Specific, Measurable, Achievable, Relevant, Time-bound.
Goal–KPI Examples:
- Regional manufacturer: Website conversion rate, cost per lead, MQL-to-SQL rate, organic search traffic.
- Nonprofit: Donor retention rate, email click-through rate, donation page conversion rate.
- Church: Website form completions, social traffic, email signup rate.
Cross & Crown facilitates workshops to define KPIs and align teams.

Core Business and Revenue KPIs
These KPIs connect marketing to revenue and sustainability.
1. Customer Acquisition Cost (CAC)
CAC measures total sales and marketing spend divided by new customers acquired.
Example: $50,000 spent to acquire 100 customers = $500 CAC.
Lower CAC means more efficient acquisition.
2. Customer Lifetime Value (CLV)
CLV estimates total revenue from an average customer before they churn.
Example: $100 per order × 10 purchases/year × 5 years = $5,000 CLV.
CLV should be at least 3× CAC for sustainability.
3. Return on Investment (ROI)
ROI measures net profit from marketing expenses.
Example: $25,000 net profit – $10,000 cost ÷ $10,000 = 150% ROI.
ROI compares channels and strategies.
4. Return on Ad Spend (ROAS)
ROAS measures revenue from paid ads.
Example: $40,000 revenue ÷ $10,000 ad spend = 4.0x ROAS.
Ecommerce brands often target 3.0x ROAS or higher.
5. Cost Per Lead (CPL)
CPL measures lead generation efficiency.
Example: $6,000 spent for 120 leads = $50 CPL.
Acceptable CPL varies by industry.
Website and Conversion KPIs
Website behavior is critical since campaigns drive prospects there.
1. Conversion Rate
Conversion rate measures how well visitors become customers or leads.
Example: 1,000 visitors, 50 purchases = 5% conversion.
2. Goal Completions
GA4 tracks form submissions, downloads, signups, donations.
3. Bounce Rate and Engagement
Bounce rate tracks single-page visits, and high rates may indicate issues.
4. Website Traffic & Source Mix
| Source | Monthly Sessions | Conversion Rate |
|---|---|---|
| Organic search | 4,200 | 3.8% |
| Paid search | 1,800 | 5.2% |
| Social | 900 | 1.4% |
| 650 | 7.1% | |
| Direct | 1,200 | 2.9% |
5. Conversion Rate Optimization (CRO)
Conversion rate optimization (CRO) is the process of testing and refining page elements—like headlines, layouts, and forms—to increase the percentage of visitors who take action. Even small changes can have a big impact.
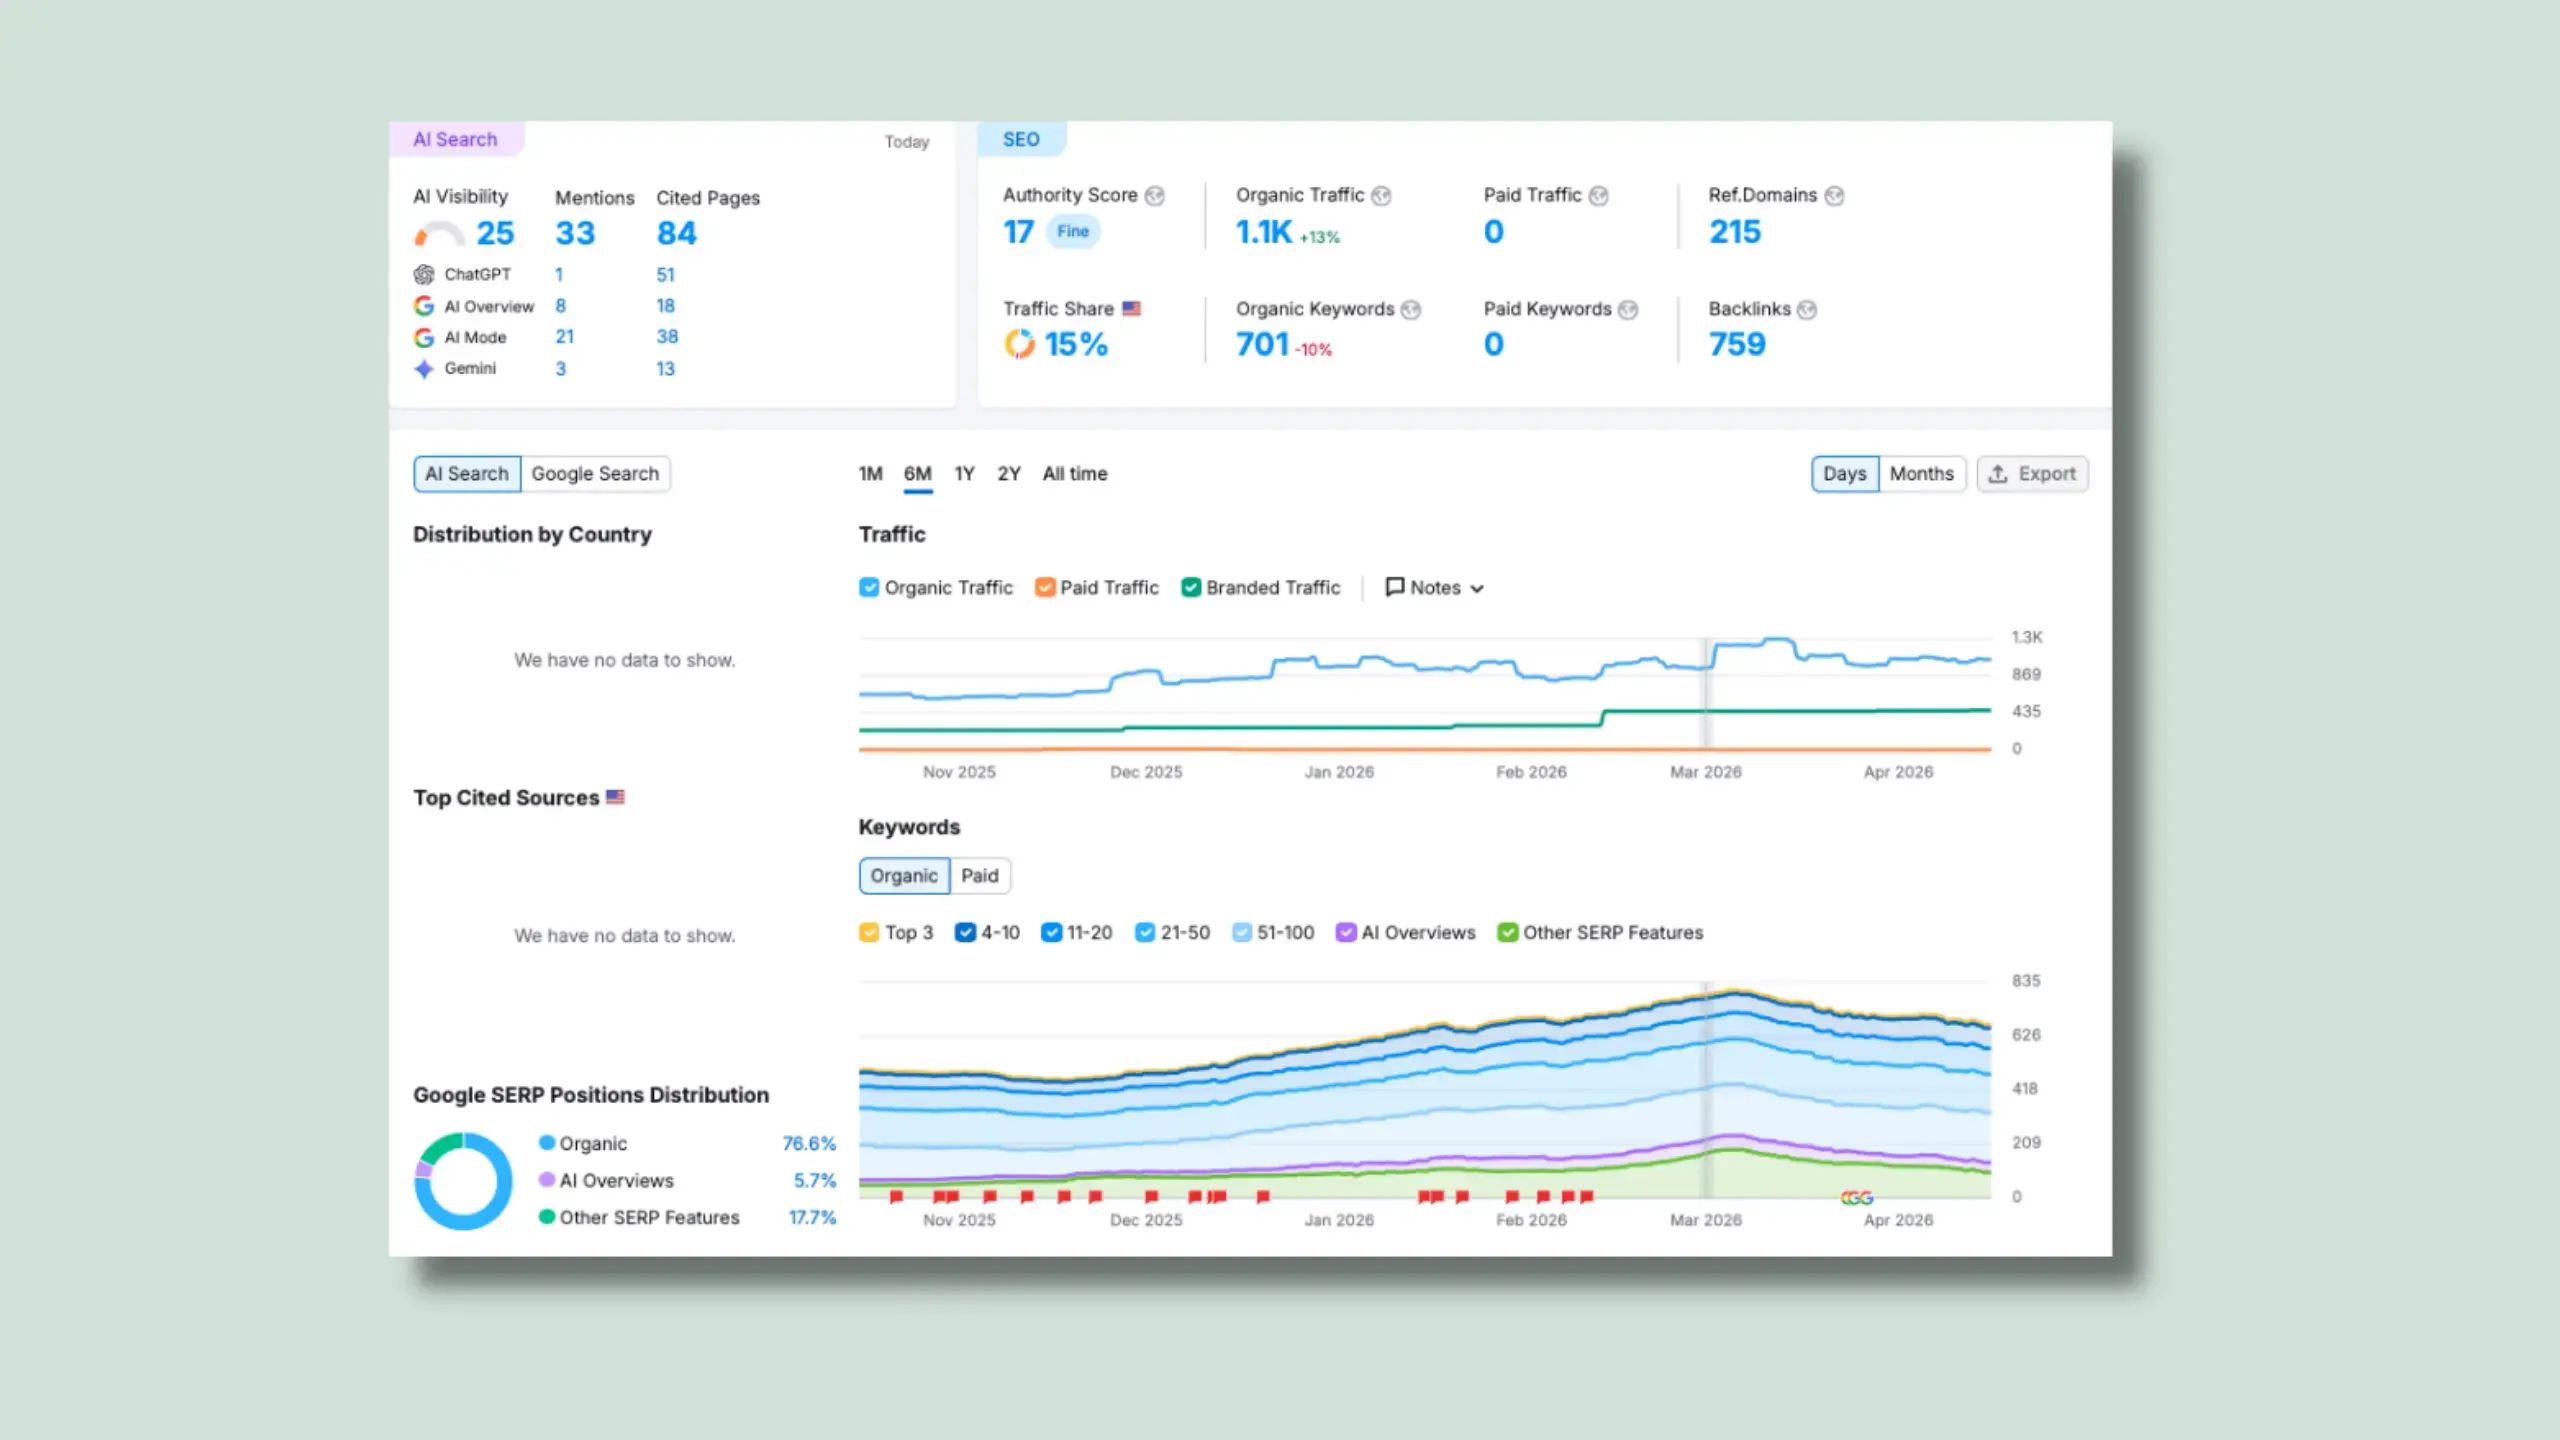
SEO KPIs (Organic Search)
SEO is a long-term investment, and these KPIs help you measure steady growth and performance over time.
1. Organic Search Traffic
Organic traffic tracks the number of visitors coming to your site from unpaid search results. Reviewing both sitewide traffic and individual landing pages helps you understand which content is gaining traction.
2. Keyword Rankings
Keyword rankings show where your pages appear in search results for target terms. Moving up even a few positions can lead to significant increases in visibility and clicks.
3. Click-Through Rate from Search
Click-through rate (CTR) measures how often users click your listing after seeing it in search results. Improving meta titles and descriptions can increase CTR without changing rankings.
4. Backlinks and Domain Authority
Backlinks—links from other websites to yours—signal credibility and trust to search engines. Monitoring referring domains and domain authority helps gauge your site’s overall strength. Strong backlink profiles support higher rankings and long-term visibility.
5. Conversion Rate from Organic Traffic
This KPI measures how many organic visitors complete meaningful actions, such as filling out a form or making a purchase. It connects SEO efforts directly to business outcomes. High traffic is valuable, but conversions ultimately determine impact.
Paid Search and PPC KPIs
Paid advertising provides immediate feedback, making it essential to monitor performance closely and adjust in real time.
1. Impressions
Impressions show how often your ads are displayed to users. High impressions indicate strong visibility, but they don’t guarantee engagement.
2. Clicks and Click-Through Rate (CTR)
Clicks measure how many users interact with your ads, while CTR shows the percentage of impressions that result in clicks. For example, 1,200 clicks from 40,000 impressions equals a 3% CTR. A higher CTR typically indicates that your ad copy and targeting are relevant to your audience.
3. Cost Per Click (CPC)
Cost per click (CPC) reflects how much you pay each time someone clicks your ad. It’s influenced by competition, targeting, and ad quality. Monitoring CPC helps you control spend and identify opportunities to improve efficiency.
4. Conversion Rate and Cost Per Conversion
Conversion rate measures how many clicks turn into meaningful actions, while cost per conversion shows how much you’re paying for each result. These metrics matter more than CPC alone, as they directly reflect campaign performance. A higher CPC can still be profitable if conversions are strong.
5. Quality Score
Quality score is Google’s rating of your ad relevance, landing page experience, and expected CTR. Higher scores can lower your cost per click and improve ad placement.
6. ROAS for PPC
Return on ad spend (ROAS) measures how much revenue you generate for every dollar spent on ads. This KPI helps determine which campaigns, ad groups, or keywords are worth scaling. Strong ROAS indicates that your paid strategy is delivering real financial returns.
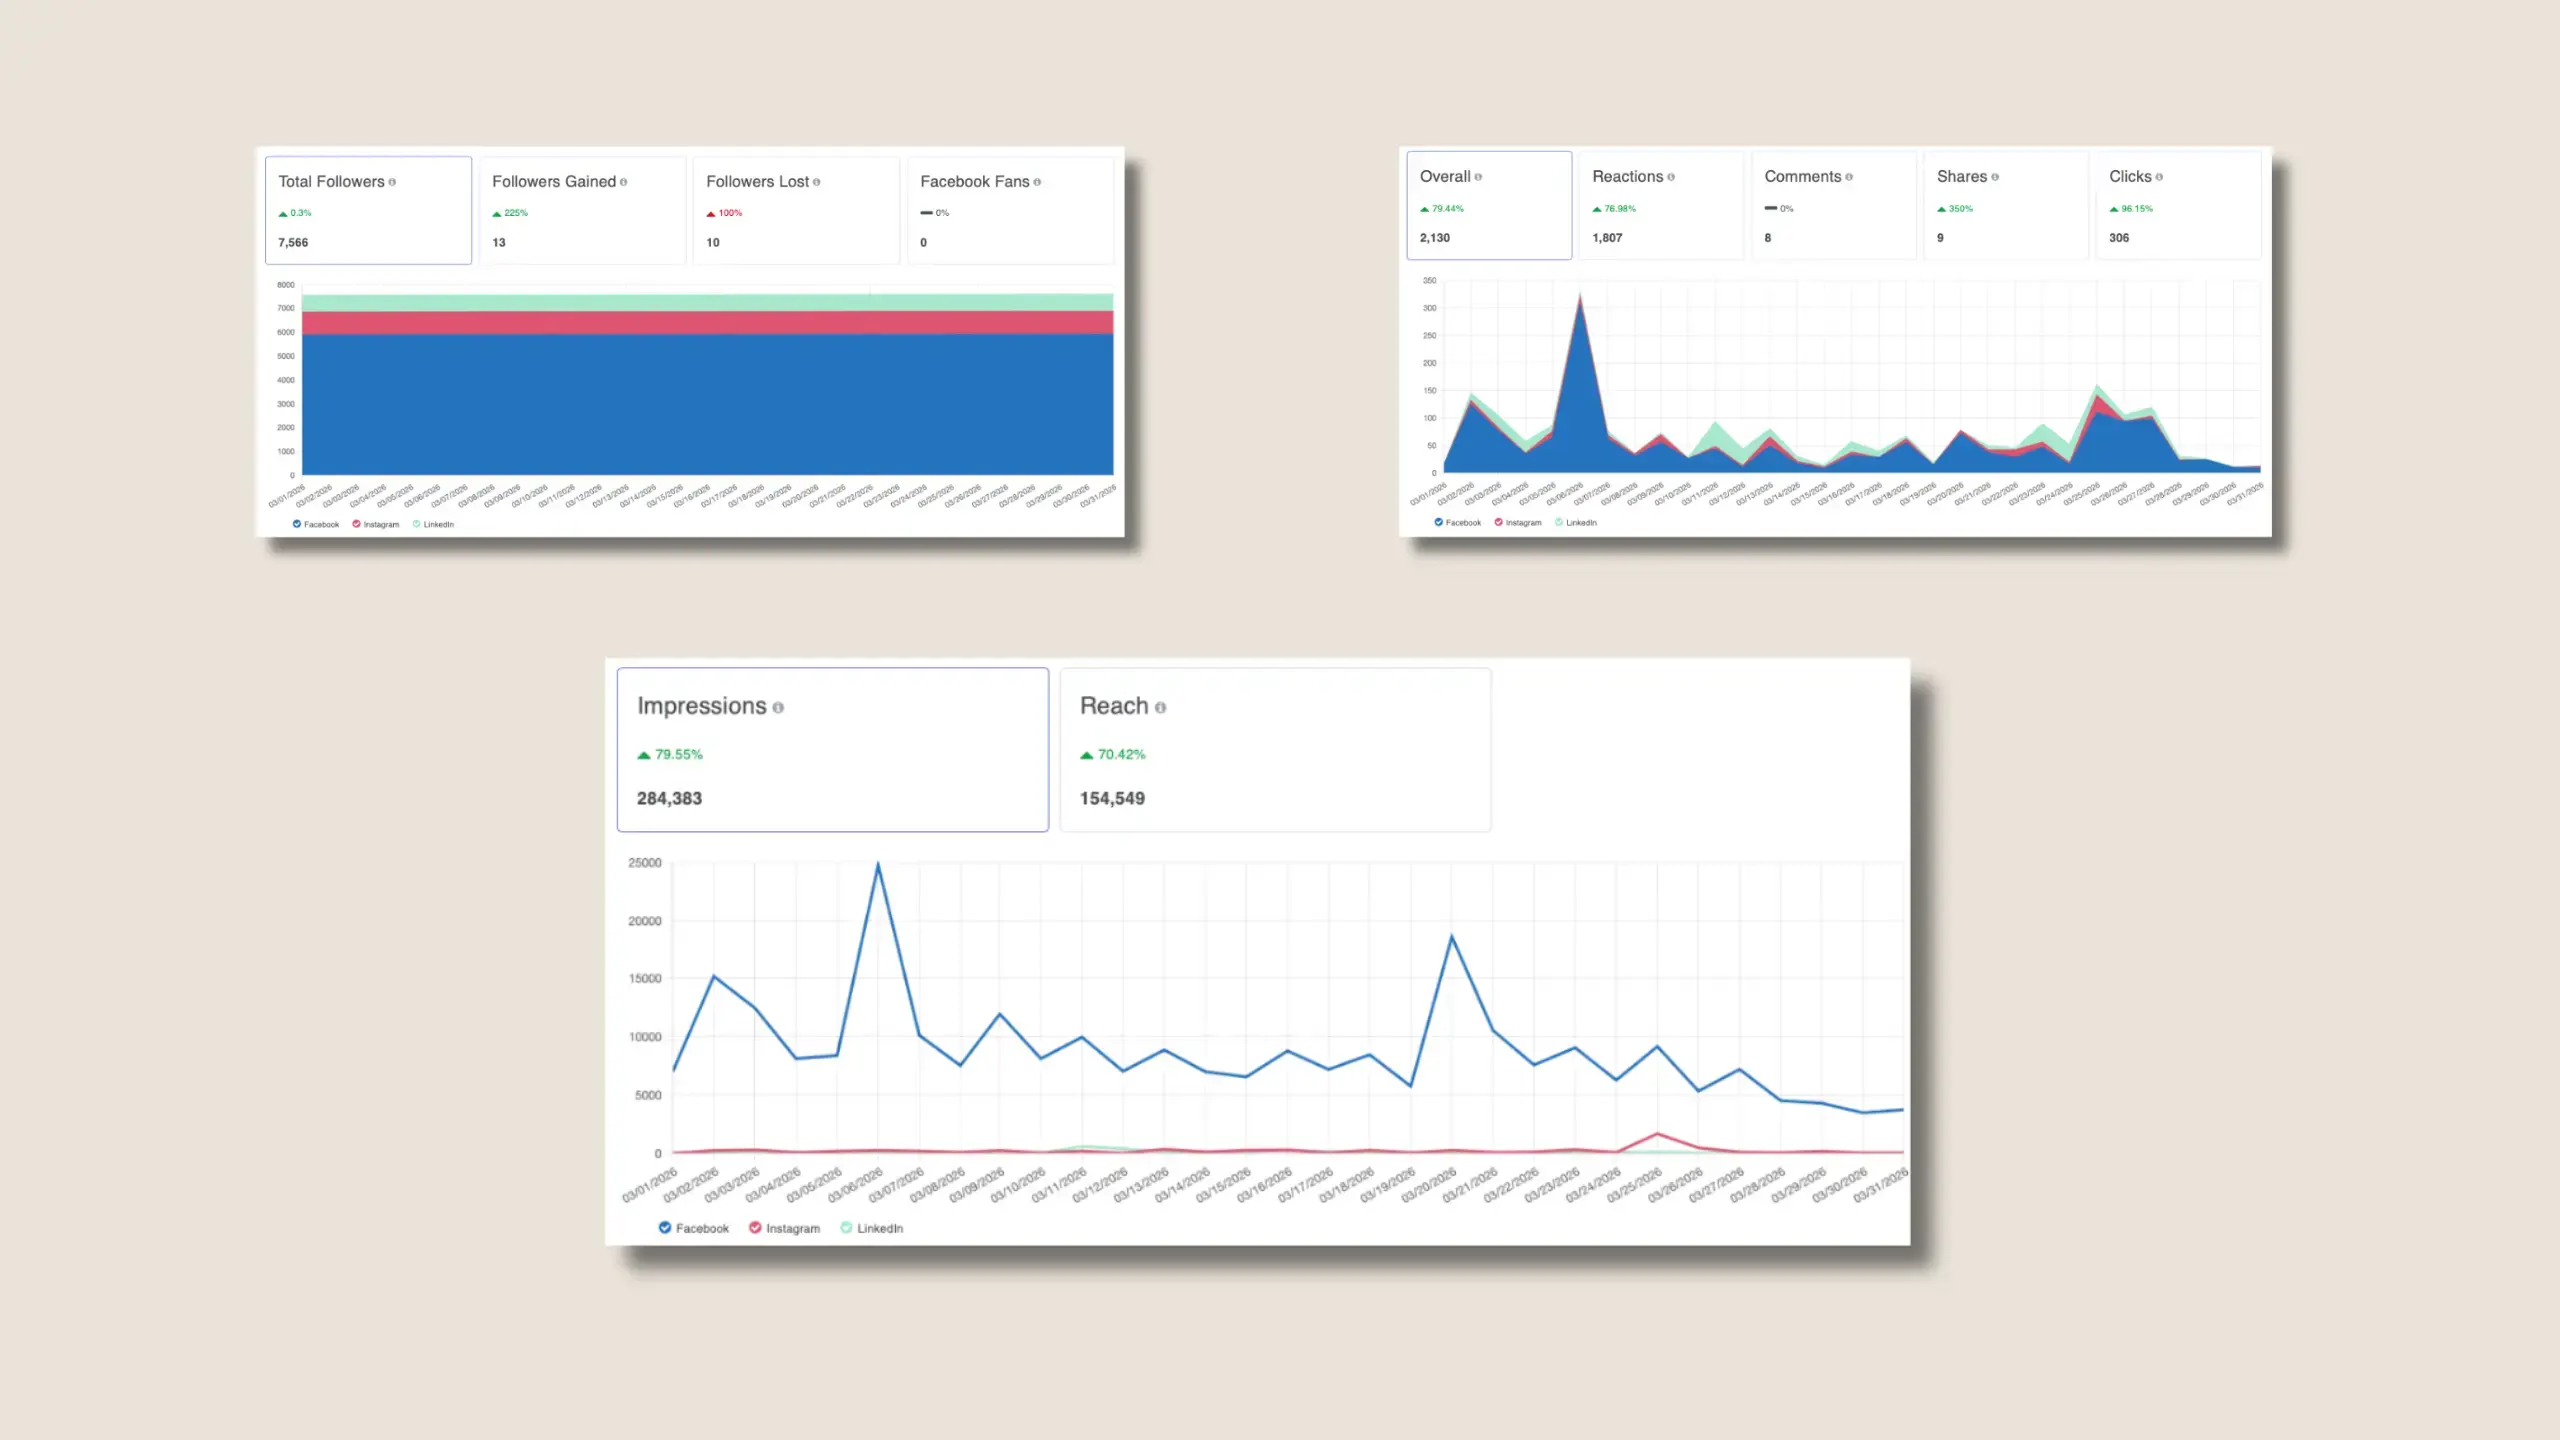
Social Media KPIs
Social media supports both brand awareness and conversions, making it essential to track performance beyond surface-level metrics.
1. Reach and Impressions
Reach measures the number of unique users who see your content, while impressions track total views, including repeat exposure. Together, these metrics indicate how widely your content is being distributed and how often it’s being seen.
2. Engagement Metrics
Engagement metrics include likes, comments, shares, saves, and link clicks. These actions reflect how audiences are interacting with your content and whether it resonates with their interests.
3. Follower Growth Rate
Follower growth rate tracks how quickly your audience is expanding over time. Consistent, steady growth paired with meaningful engagement is more valuable than sudden spikes that don’t translate into interaction or conversions. This KPI helps gauge long-term brand interest and audience relevance.
4. Social Traffic and Conversions
This KPI tracks how many users visit your website and complete actions—such as form submissions, purchases, or donations—after clicking from social platforms. Using tools like UTM parameters and analytics platforms allows you to attribute results accurately. It’s one of the clearest indicators of how social media contributes to business or mission outcomes.
5. Share of Voice and Brand Mentions
Share of voice measures how often your brand is mentioned compared to competitors within your industry or region. Brand mentions and sentiment analysis provide insight into how your audience perceives your organization. Together, these metrics help evaluate your overall presence and reputation in the digital conversation.
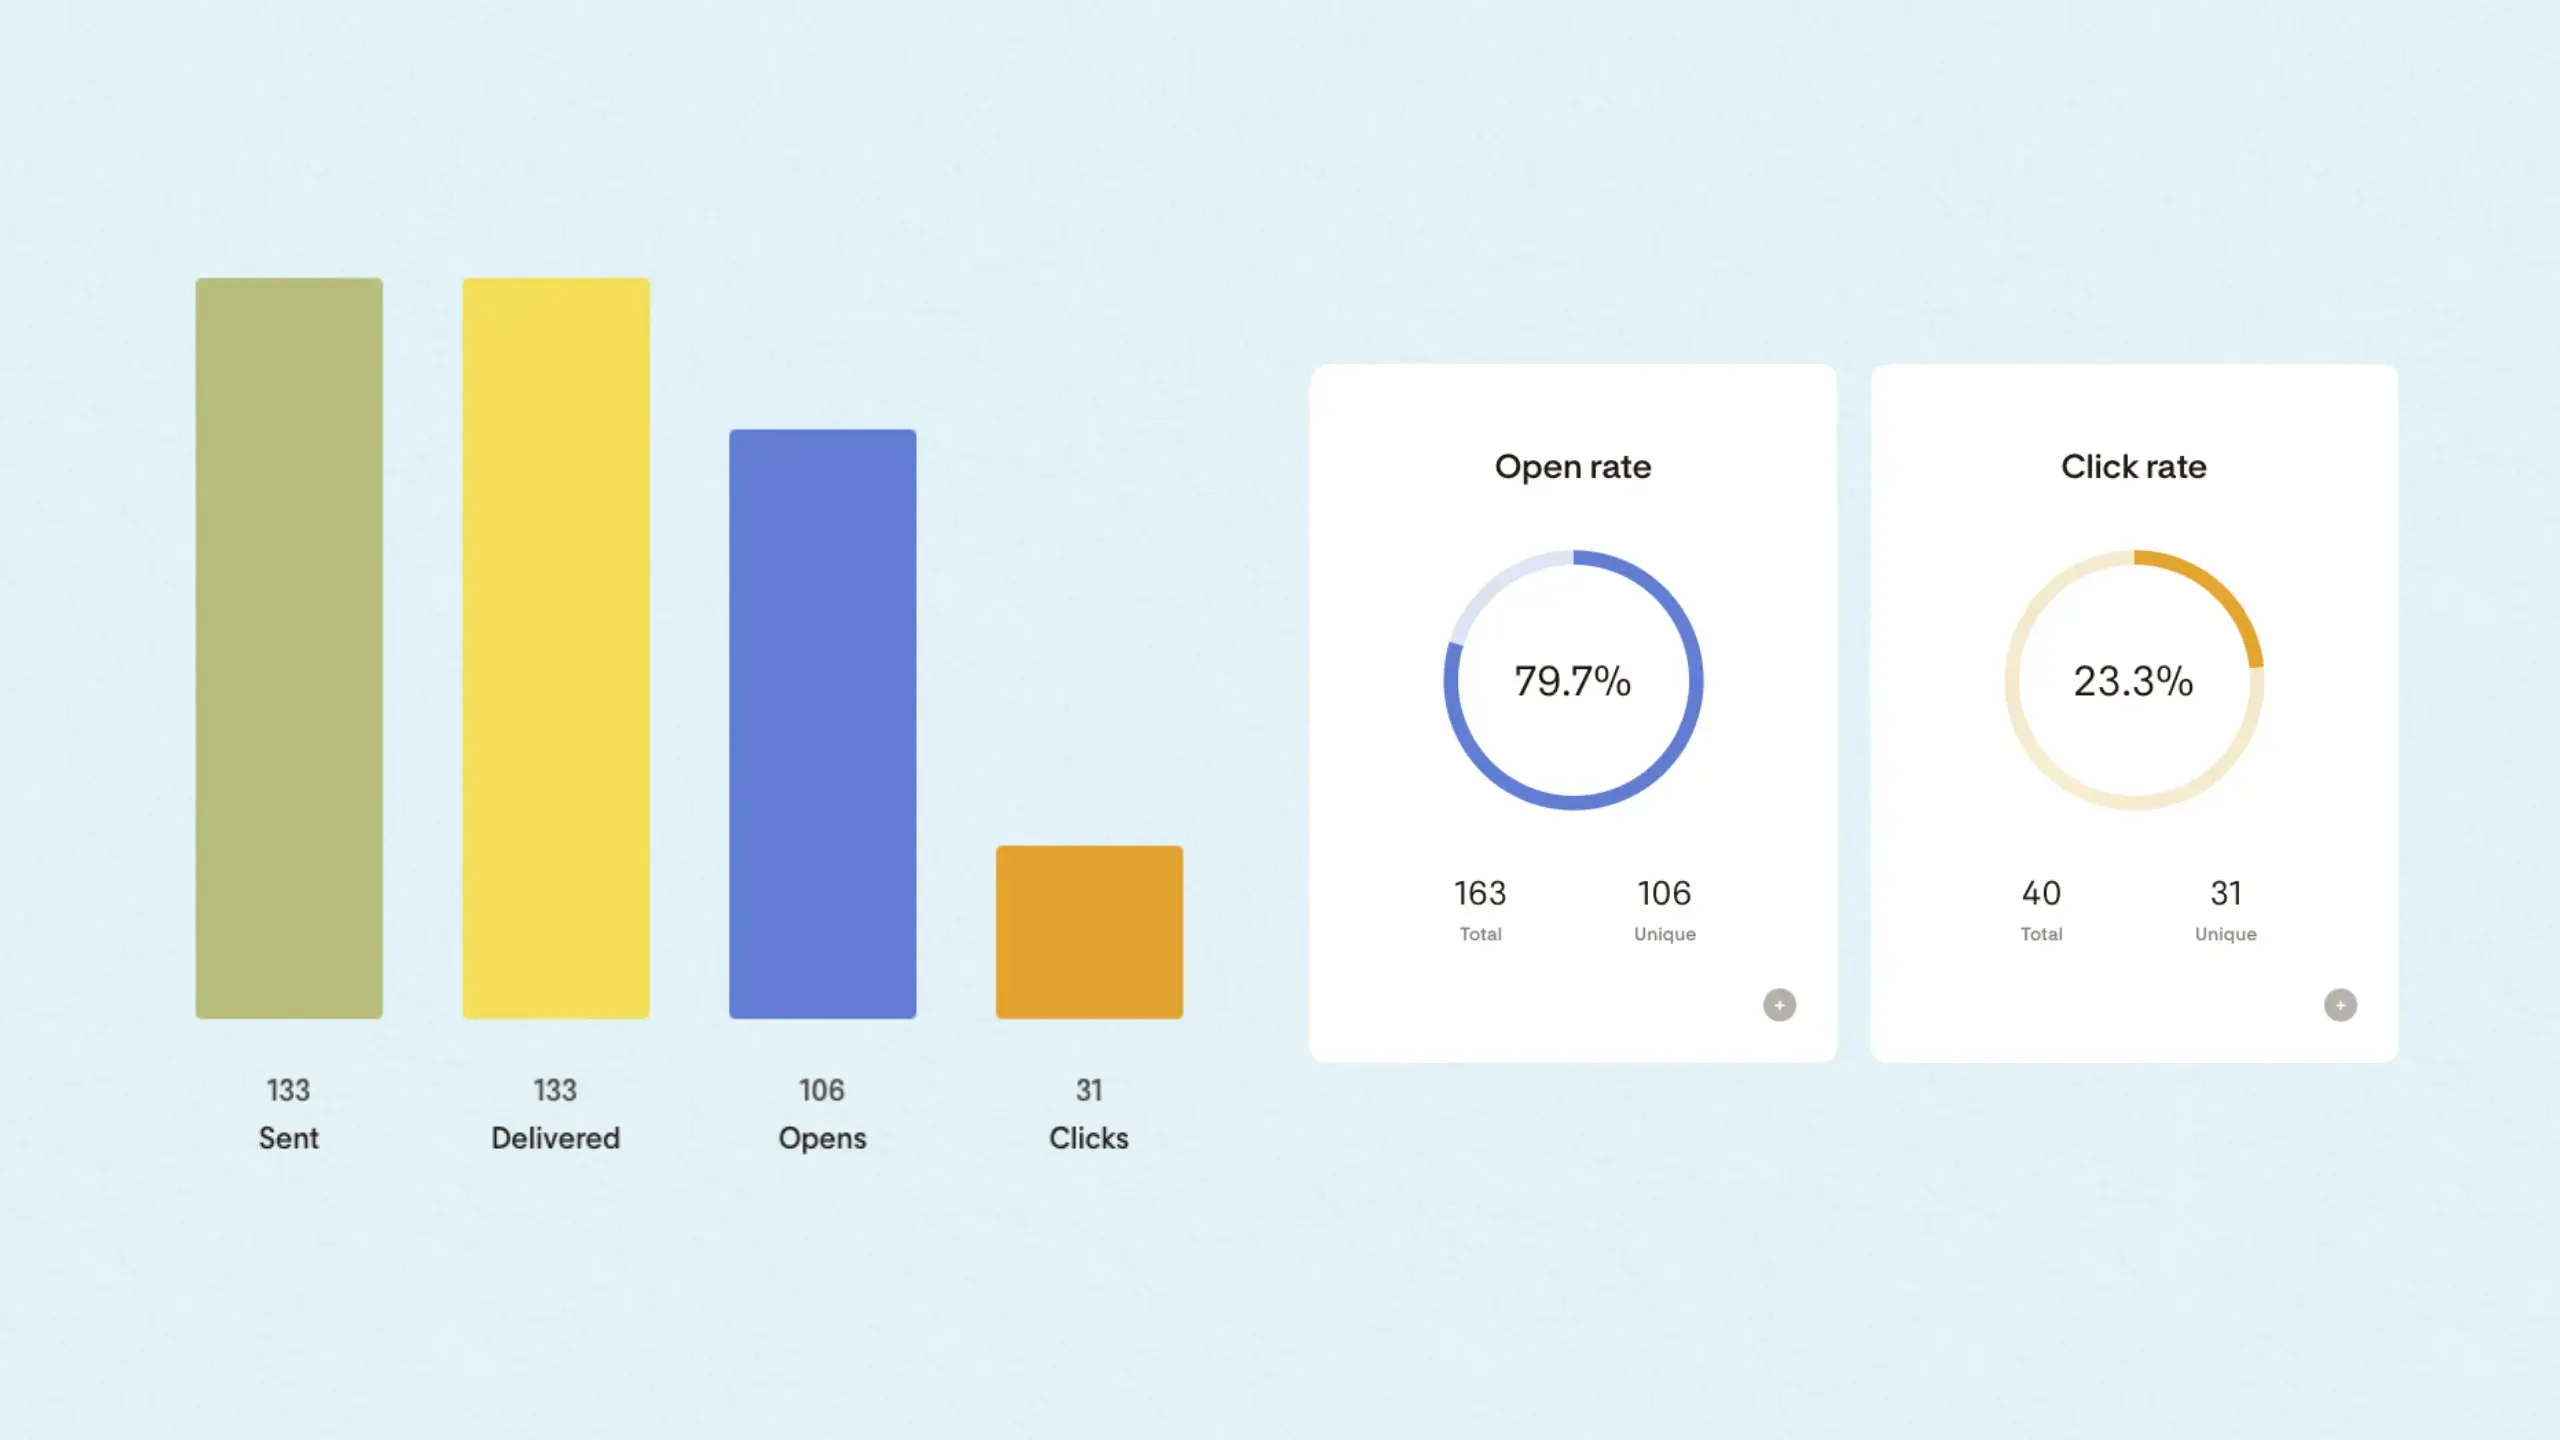
Email Marketing KPIs
Email remains one of the highest-ROI marketing channels, especially for organizations focused on retention, recurring engagement, and direct response.
1. List Growth and Signup Rate
List growth tracks how many new subscribers are added over a given period, while signup rate measures the percentage of visitors who join your list. These metrics reflect how effectively your content, lead magnets, and calls-to-action attract new audiences.
2. Open Rate
Open rate measures the percentage of recipients who open your email campaigns. Typical open rates range from 15–25% for engaged lists, though this can vary by industry and audience size. This KPI is influenced by subject lines, sender name, and timing, making it a useful indicator of initial audience interest.
3. Click-Through Rate (CTR)
Click-through rate (CTR) tracks how many recipients click on links within your email. An average CTR of around 3% generally indicates solid engagement, though benchmarks vary.
4. Conversion Rate from Email
This KPI measures how many recipients complete a desired action after clicking—such as making a donation, completing a purchase, or registering for an event. It connects email performance directly to business or mission outcomes.
5. Bounce Rate and Unsubscribe Rate
Bounce rate reflects the percentage of emails that fail to deliver, with hard bounces (invalid addresses) ideally staying below 2%. Unsubscribe rate measures how many recipients opt out of future emails, with a typical benchmark under 0.5%. Monitoring both helps maintain list health and ensures your content remains relevant and well-targeted.
Lead Quality, Pipeline, and Retention KPIs
For many organizations, success depends not just on lead volume, but on attracting qualified leads and retaining them over time.
1. Marketing Qualified Leads (MQLs)
Marketing qualified leads (MQLs) are prospects who meet defined engagement and fit criteria, such as multiple website visits, content downloads, or matching target demographics. These leads have shown enough interest to be nurtured further by marketing.
2. Sales Qualified Leads (SQLs)
Sales qualified leads (SQLs) are prospects that the sales team has vetted and deemed ready for direct outreach. These leads typically meet criteria related to budget, authority, need, and timeline. The transition from MQL to SQL is a critical indicator of alignment between marketing and sales efforts.
3. Pipeline Velocity
Pipeline velocity measures how quickly leads move from initial contact to a closed deal or conversion. Faster velocity indicates an efficient sales process and strong alignment between messaging and buyer needs. Slower movement may reveal bottlenecks in follow-up, nurturing, or sales execution.
4. Customer Retention Rate
Customer retention rate tracks the percentage of customers who continue doing business with you over time. High retention often signals strong satisfaction, effective onboarding, and consistent value delivery. Improving retention can significantly increase profitability, as it is typically more cost-effective than acquiring new customers.
5. Net Promoter Score (NPS)
Net Promoter Score (NPS) measures customer loyalty by asking how likely someone is to recommend your organization on a scale from 0 to 10. Responses are grouped into detractors, passives, and promoters to calculate an overall score.
Implementing KPIs with Cross & Crown
KPIs only matter if they actually shape decisions—how you design, where you invest, and what you refine over time. Otherwise, they’re just numbers on a dashboard.
At Cross & Crown, we focus on making KPIs practical and actionable. That starts with defining clear goals, selecting the handful of metrics that truly matter, and setting up the right tracking tools to capture meaningful data. From there, we build simple dashboards and establish a consistent review rhythm so your team knows what to look at—and what to do next.
Rather than treating marketing as a one-time project, we integrate KPI tracking into everything—your website, branding, and campaigns—so performance improves over time, not just at launch.
Ready to get clarity on what’s working and what’s not? Connect with Cross & Crown to start building a smarter, KPI-driven marketing strategy.

Cross & Crown
Based in Chambersburg, PA, we build & refine brands that inspire trust, drive engagement, lead with purpose, and ensure a thriving future.
Read More

July 13, 2026
What Today’s Most Successful Financial Institutions Understand About Marketing
Explore modern marketing strategies for banks and financial institutions designed to improve customer acquisition, engagement, and retention.
Read Post
July 6, 2026
The Differences Between AI Search, Google Search, and Social Search
Explore the differences between AI search vs Google search, including a Perplexity AI vs Google Search comparison and what it means for your business.
Read Post
June 24, 2026
How to Market a New Private School (and Build Trust from Day One)
Learn how to market a new private school, build trust with families, and grow enrollment from day one. Discover proven strategies to get started today.
Read Post